Analytics: Personalise Search and Product View
Personalise search and product view
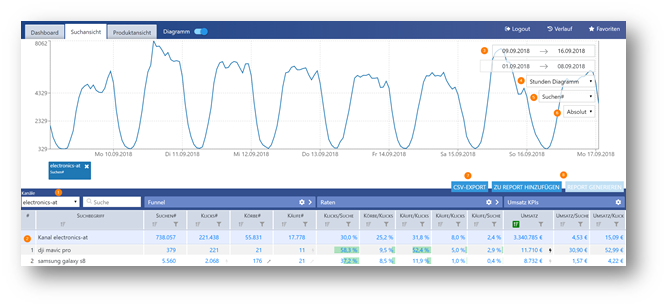
The search view provides an overview of the search terms received and their most important KPIs.
The search terms are grouped by channel (1) and can be sorted by KPIs. To do this, simply left-click on the column header. The entire channel is at the top of the search terms as a comparative value (2).
The KPIs are divided into several groups, of which individual values can be hidden. These are then displayed again by clicking on the group name.
As with the dashboard, the displayed interval can be user-defined (3).
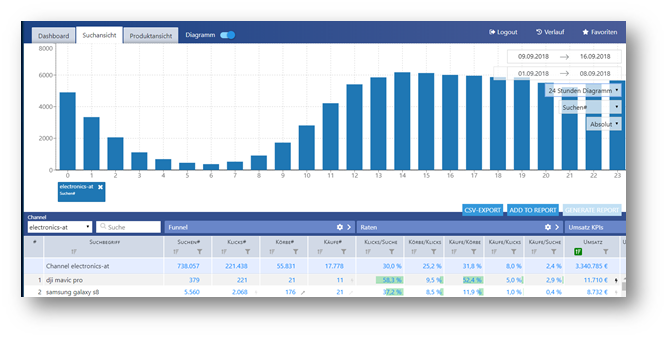
The selected data can be visualised either as a curve (standard view) or as a 24-hour bar chart (4).
The penultimate drop-down (5) allows you to set all search terms displayed in the diagram to one KPI (e.g. search count).
The last option allows you to switch from an absolute view to a relative one. This is useful, for example, to measure individual search terms against the daily trend.
Create filters?
In the default setting all products or search terms are listed. However, it is also possible to restrict this display.
You can create these filters by clicking on the symbol below the KPI designation:
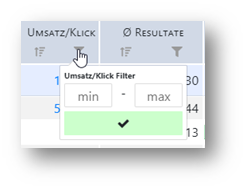
Here you can define one or more filter conditions, e.g. only show articles that have generated between 100€ and 1000€ turnover:
Click on the![]() button to complete the process.
button to complete the process.
Compare values?
You can compare all possible metrics in the diagram. Just click and hold the desired value and drag it to one of the colour fields in the diagram.
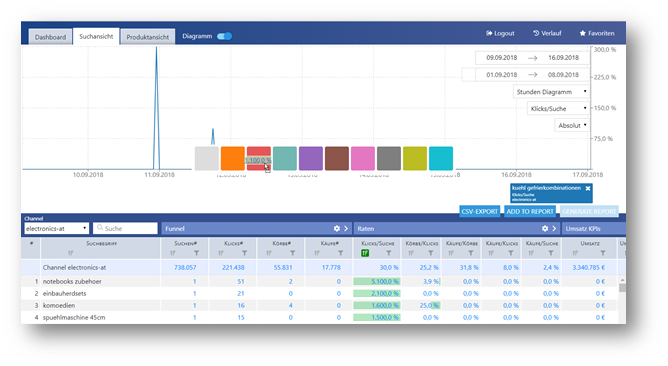
You can also compare several values of a search term, e.g. click and add-to-cart rate.