Analytics Reports
The FactFinder Report Section
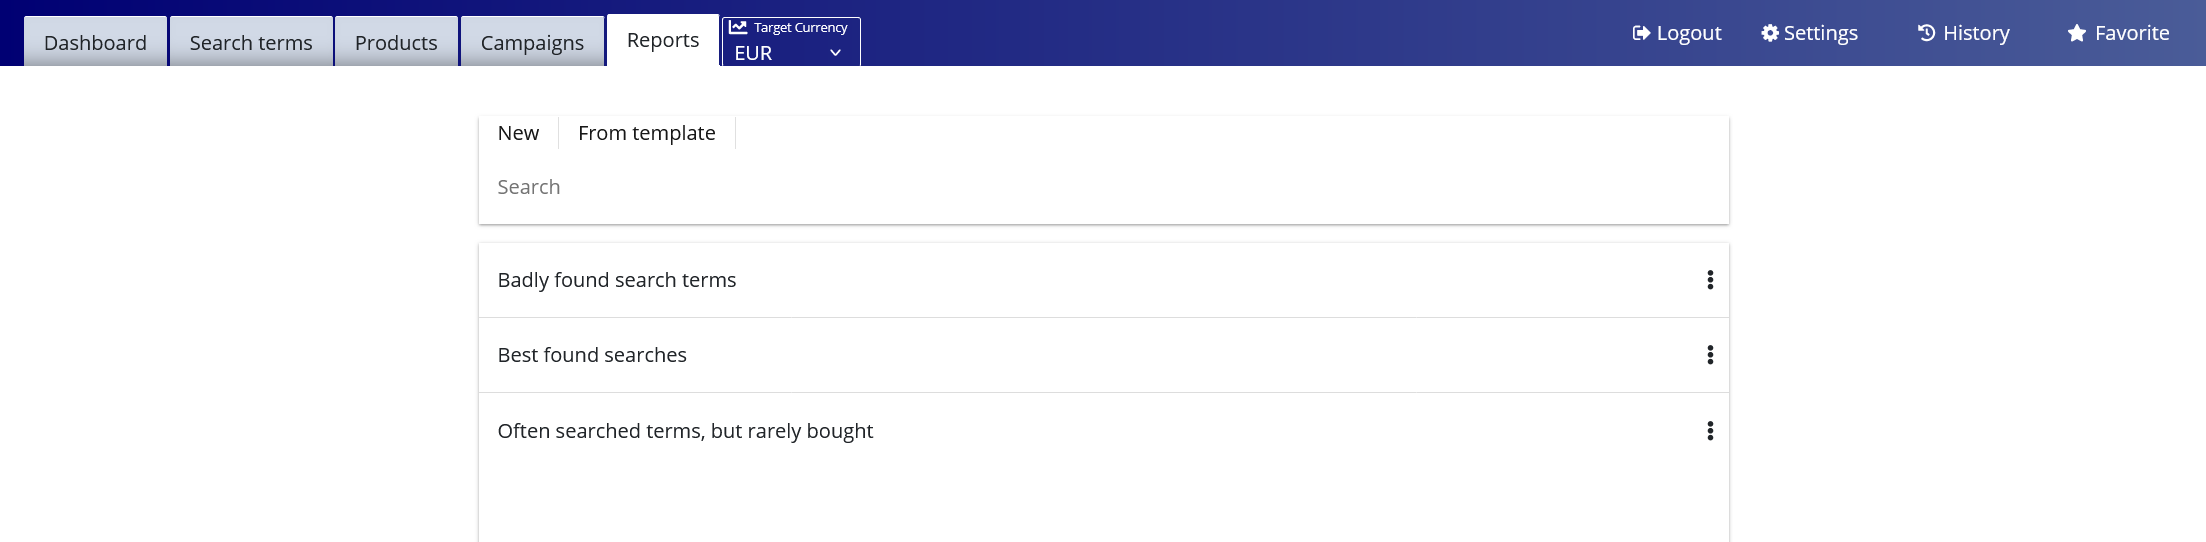
After logging into the FactFinder Analytics section, a total of five tabs are available at the top - the last one leads to the report section of FactFinder.
Here, reports can be created to analyze and illustrate the analytics data. In addition, report templates can be created and saved in order to analyze the same key figures on a recurring basis.
By clicking on "New", reports can be created from scratch. By clicking on "From template", existing reports/templates can be used. With the latter option, a new name should first be assigned to the report,
so that the old report/template is retained and not overwritten when saving.
Note: The terms report and template are not clearly distinguishable. Basically every report can be used as a template to create another report (important: change name before saving). Each report is automatically displayed as a template.
On the FactFinder side, a report template is already available: the Standard Report. This contains frequently used analyses, such as an overview of the history of search queries and clicks, the most searched search terms, the search terms with the highest turnover and much more.
Create a report
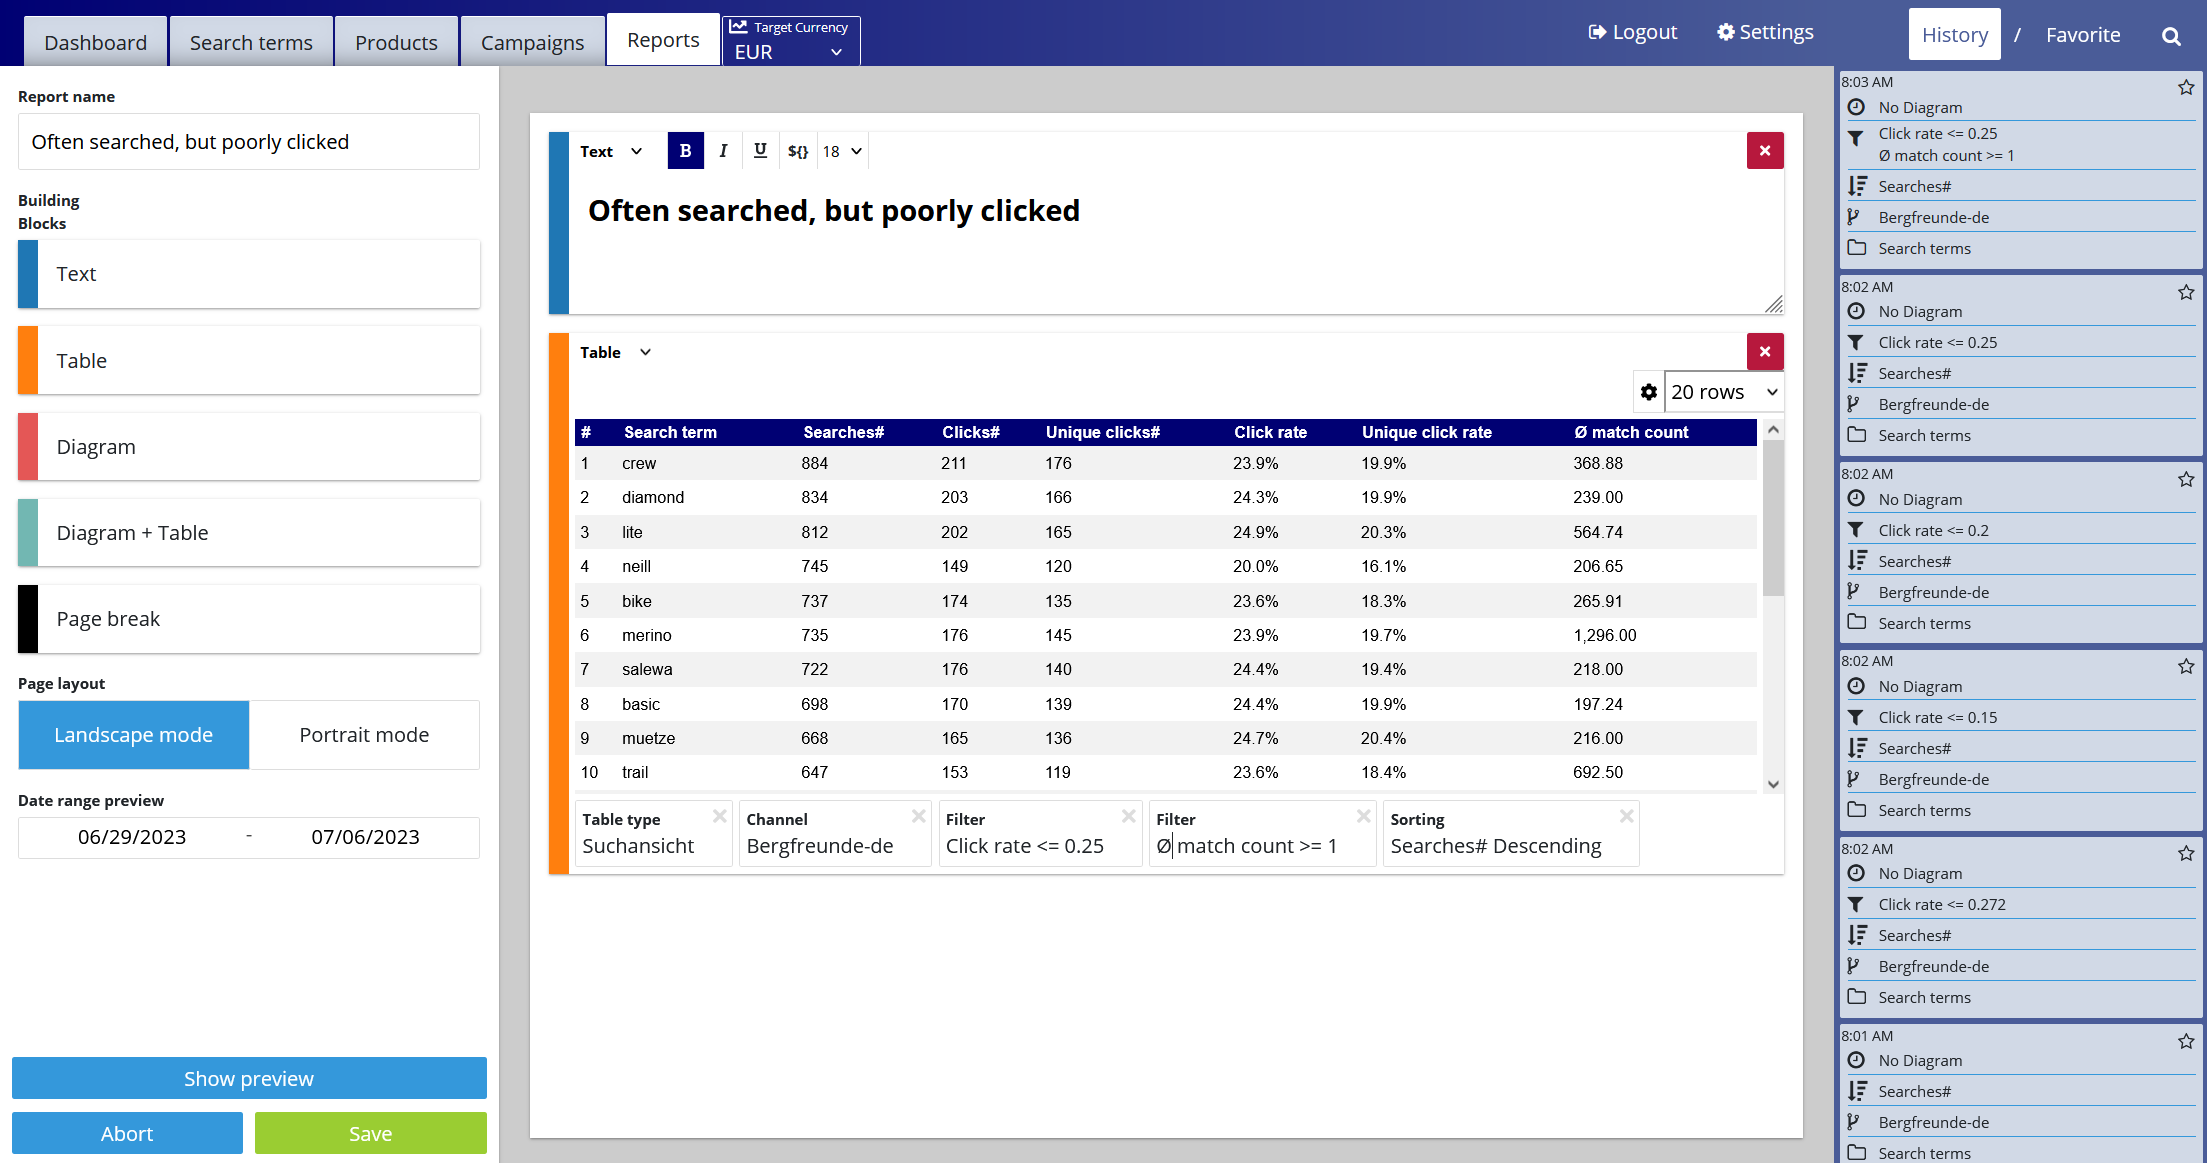
After clicking on "New" an empty report opens. First, a report name should be assigned as described.
Individual elements of a report are always made up of two sub-elements - 1. type of display called modules and 2. the data. Both can be added to the report simply by drag & drop and linked to each other.
First, a module (e.g. a text field or a table) must be added to the report (the empty white area in the middle) from the left side. Afterwards, data from the history or the favorites (these are histories marked as favorites) can be linked to a module, e.g. a table.
Further editing options are available. In the following example, a text module has been added and the selection of the columns to be displayed in the table has been changed (settings icon, top right in the table).
Existing reports/templates can be revised and adapted in the same way.
Reports can also be created via the "From template"-tab. If you choose to create reports this way, you can choose between these 5 kinds of templates:
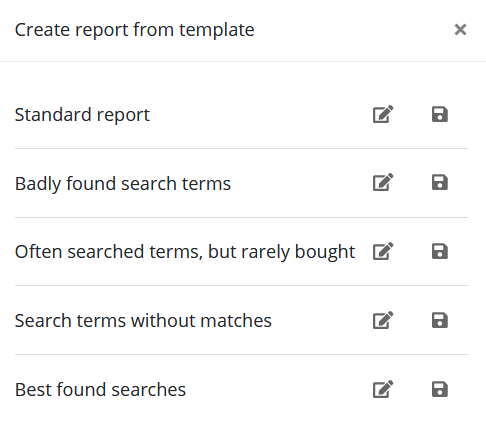
In many cases, it is sufficient to use the "Standard report" as a starting point.
Background and application examples
It is very important to keep a constant eye on certain key figures in order to be able to derive optimization measures and thus continuously improve target figures that are important for the online store.
Since in most cases the same key figures are considered, the report function proves to be useful.
In this way, analyses can be created once and viewed again and again as needed. Which key figures are analyzed is a customer-specific decision. FactFinder offers a wide range of options in the analytics area (a prerequisite for this is fully integrated tracking). An overview of all key figures can be found here: KPI overview
In general, however, it makes the most sense to focus on the most frequently searched terms, as these offer the greatest financial leverage.
Furthermore, it is always worthwhile to compare two key figures with each other. Only in this way is it possible to derive meaningful measures for optimization. Alternatively, the temporal observation of a key figure can also reveal optimization potential.
A possible approach could look like this, for example:
- Viewing the top 50 search terms, i.e. the 50 most frequently searched terms.
- Consideration of the key figures clicks and searches. These two metrics are already put into relation by FactFinder by default, the resulting metric is the click-through rate.
- Determination of a benchmark to define which search terms are in need of optimization. The average value of the click rate is suitable here. FactFinder already provides this in the search term overview for all key figures (top row of the table).
For example, all search terms with a below-average click rate could be defined as requiring optimization. - By setting a filter, the differently clicked search terms can be viewed and recorded in a report. In this way, they can be retrieved updated at any time.
In the same way, other key figures can now be put into relation (searches and purchases, searches and number of hits, etc.) in order to identify further optimization potential and increase important target key figures such as sales or the conversion rate.